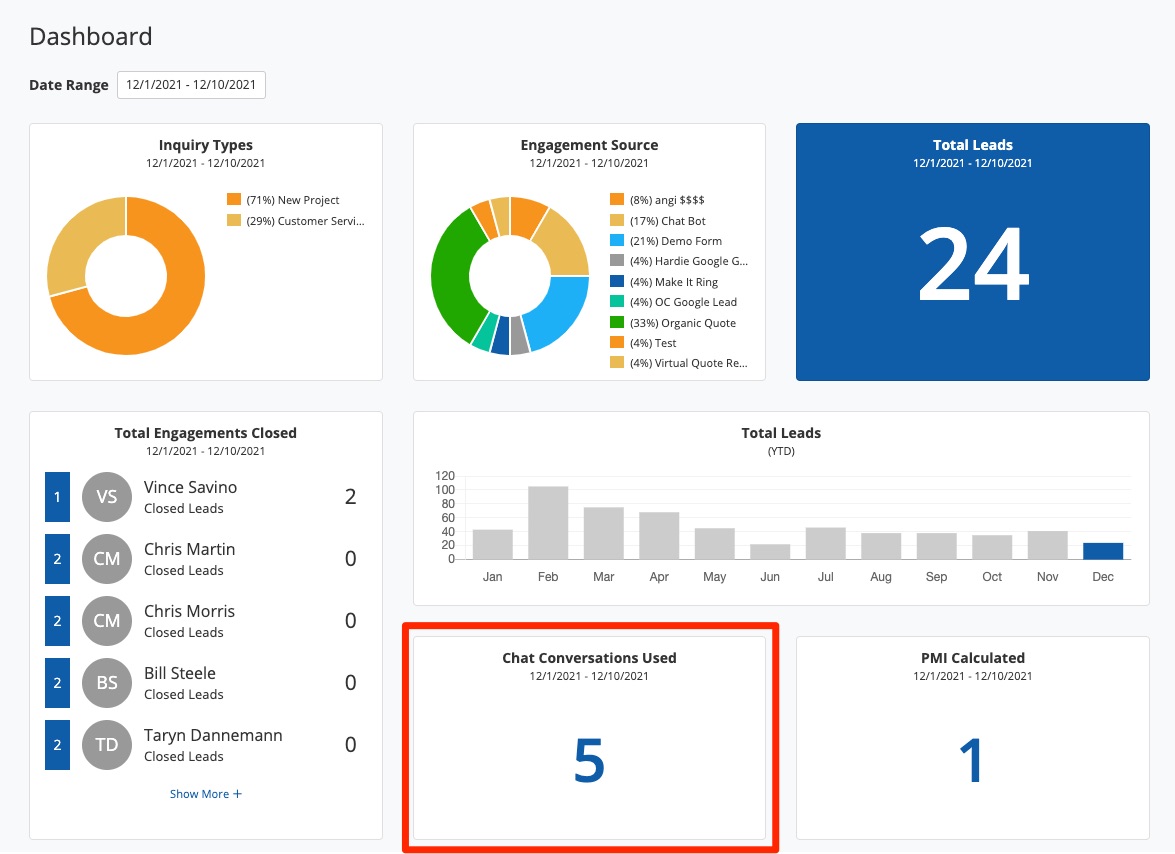
When you first log into PSAI, you'll arrive on your company's PSAI dashboard. This dashboard provides a quick summary of your lead engagements and user performance. Using the date range field at the top, you can view insights into any period of time.

Like the rest of PSAI, the Dashboard is mobile-friendly! You can set a shortcut on your phone or tablet to use all of the PSAI tools on the go.
Below we'll look closer at each panel of the Dashboard and what it means.
Inquiry Types

The Inquiry Types panel displays the various inquiry types that have come into your company this month. These may include:
- Billing Claim
- New Project
- Project Status
- Reschedule
- Unknown Inquiry
- Warranty
Engagement Source
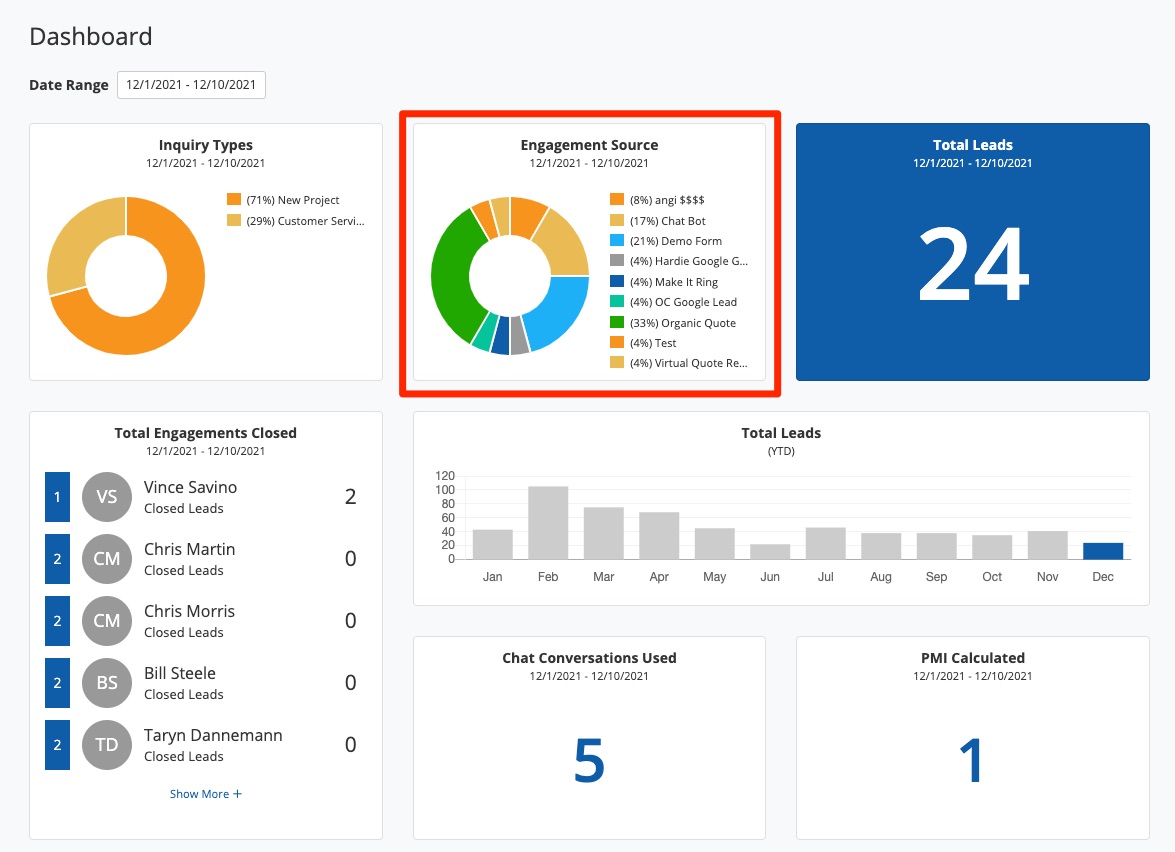
The Engagement Source panel shows you where your leads are coming from. The pie chart displays a visual breakdown of all leads entering your Com Portal, including:
- Leads from PSAI site conversion tools, such as Gia chat and floating buttons
- Leads from Facebook or Instagram, generated through Ads Manager and/or storm campaigns
- Leads from any other sources (such as the LISA platform if you're a Spectrum Enterprise client)
Total Leads
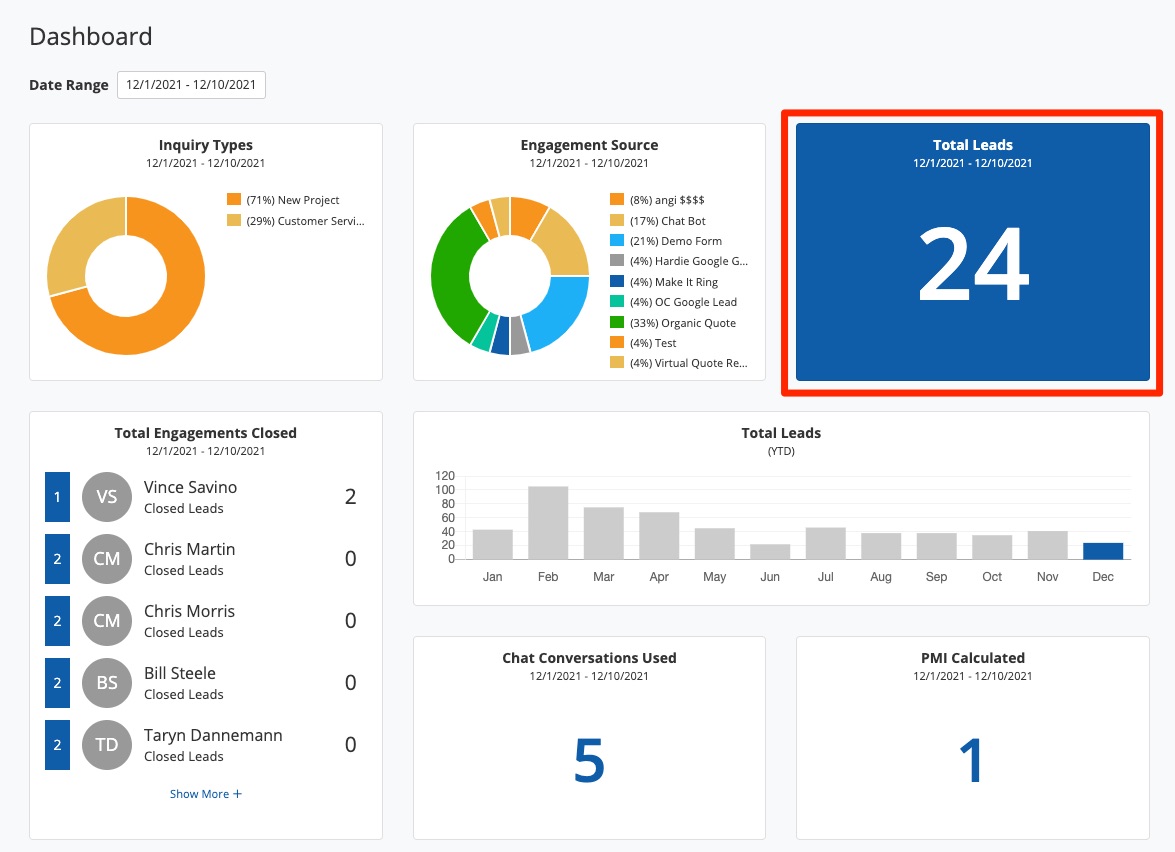
Like the name suggests, the Total Leads panel displays the total leads you've generated through PSAI in the current month. In addition to the numerical display of total leads for the current month, it provides a month-to-month percentage comparison.
The Total Leads count reflects the latest changes to your contact list so that each person is counted as a lead (not each individual interaction or conversation).
Did you know? You can manually add leads to PSAI, too! By adding a lead manually, you will be able to communicate with the lead through the Com Portal, and you'll see the lead reflected on the panels of your PSAI Dashboard.
Total Engagements Closed
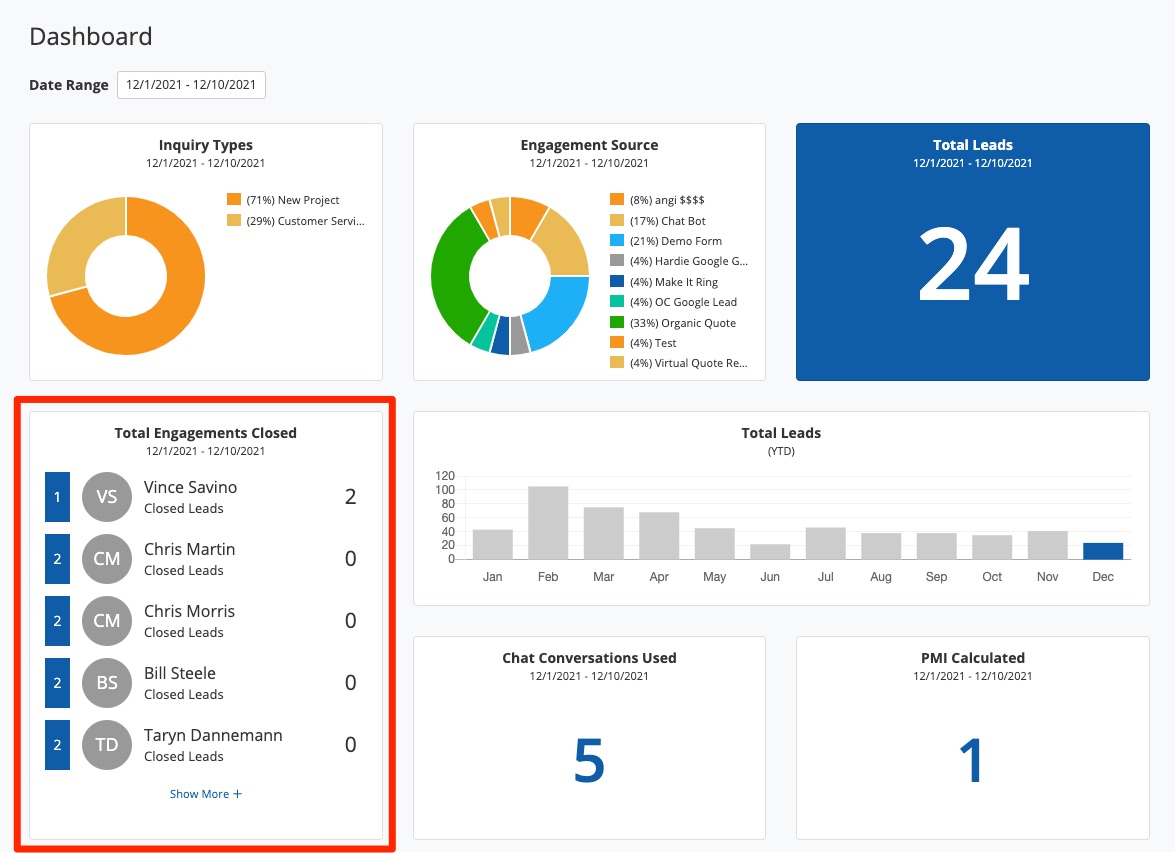
This display offers a quick look at the number of engagements closed by each of your PSAI users through the month to date. It then ranks your PSAI users from the highest number of total lead engagements closed to the lowest, which are reflected in the blue numbers at the left-hand side.
Not sure what it means to "close" a lead engagement? Learn more about closing leads in the Com Portal.
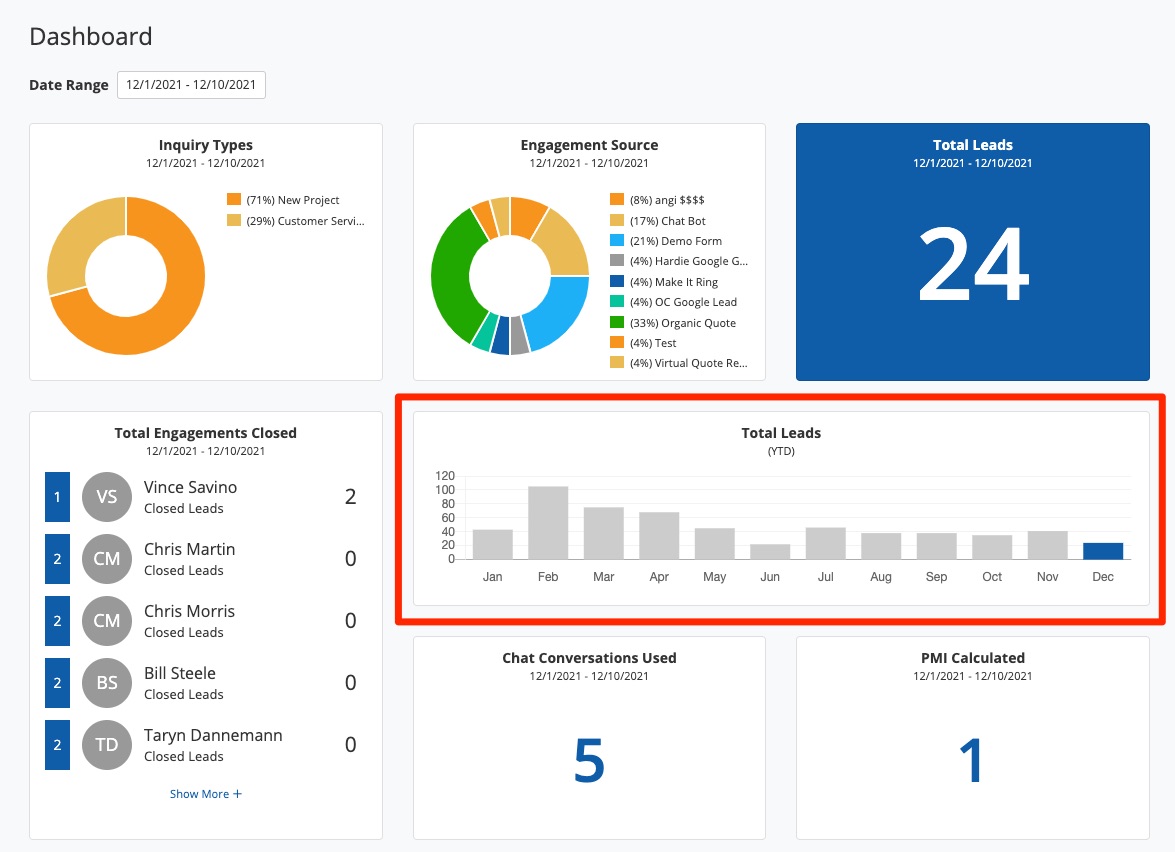
Total Leads (YTD)
This graph displays the total number of leads for each month for the year to date, giving you a quick comparison overview. (Again, each PSAI contact counts as a lead rather than each individual interaction from a contact.)
Chat Conversations Used
This panel shows a numerical display of the number of chat conversations used for the current month to date. (The total number of chat conversations available to you will depend on your PSAI subscription.)
The term “chat conversation” refers to complete chats (in which the customer left the chat conversation), not each individual “chat message” sent. Learn more about the chatbot here.
PMI Calculated

This panel provides a numerical display of the number of PMI calculated. (The number of Predictive Insights™ you can calculate varies based on your PSAI subscription level.)
You can learn more about PSAI's Predictive Insights™ in our overview.
New to PSAI? Then continue exploring by checking our our beginners' guide to the Com Portal or our PSAI starter pack.